
- Published on
The Standup That Already Knew the Root Cause
- Authors

- Name
- Siavoush Mohammadi
- The Number on the TV That Didn't Add Up
- The Walk, Logged Against the Standup Clock
- Two Questions at Every Hop
- The Same Bug on a Warehouse Nobody Declared
- Fixed Once, Healed Everywhere
- What Walking Cannot Fix
- A Colleague That Investigates
The Number on the TV That Didn't Add Up
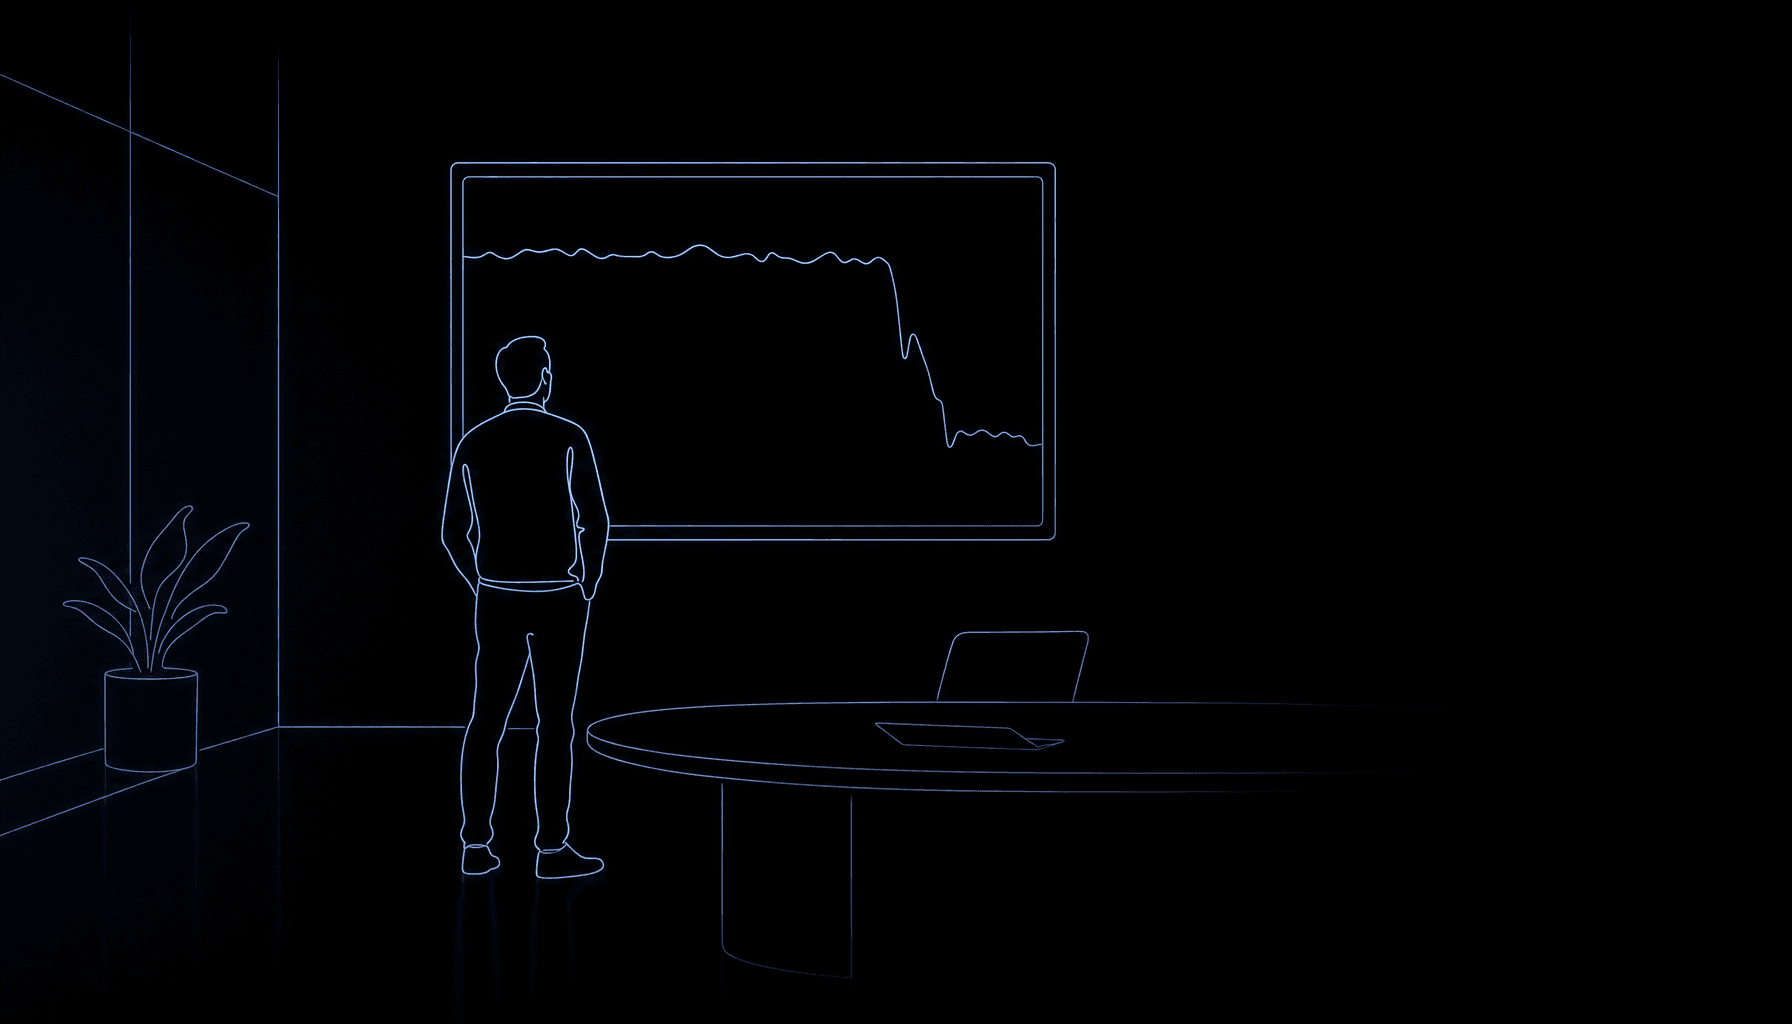
One of our clients has a big TV on the office wall that shows numbers from their platform all day. Most mornings it's furniture. That morning I walked past it on the way to standup and stopped, because churn looked wrong.
I was still pointing at it when a senior leader posted in a public channel to the data team. The gist: these numbers must be wrong, churn can't be that low for that date. If you've worked in data for more than a week, you know that message. The dashboard is on trial, the data team is the defence, and nobody in the room has seen the evidence yet.
Standup was next, fifteen minutes on the calendar. I raised it, and everyone agreed to look into it, which is what everyone always agrees to. Usually it means somebody loses an afternoon.
The question had already been narrowed to one fact before anyone sat down: churn for one day was a small fraction of a normal day. So while standup carried on around me, I asked my agent (the one that works on the business model) to find out why.
Making "Talk to Your Data" Actually Work argued that an agent can answer business questions once the platform declares what the business means, and it promised to tell this one properly. The difference is that nobody here asked the agent for a number. We asked it why a number was wrong.
The Walk, Logged Against the Standup Clock
The agent started where the number lives: the consumption layer, the tables a dashboard reads. It read the declaration of the subscription-event fact table, which says which columns flag a churn, which column is the time axis, and which business-model view the table takes its rows from. Then it queried the day. Low. The dashboard was faithfully showing what it had been given.
One level down sits the business model. The subscription entity's declaration names its status attribute and how that attribute is ingested: as a full log, the whole source read on every run. No watermark, so no watermark that could have skipped a day. The pipeline also records the batch windows it ran, and the day in question had been read. The agent counted again at this layer. Still low. The engine had skipped nothing.
Next came the mapping from the entity to its source, and the view that names the exact staging tables and the joins between them. One lookup was enough to see that those joins couldn't drop a day. Whatever was missing was missing before the business model ever saw it.
Staging is where it got interesting. The transition events table declares two times as separate columns: when the event happened, and when it was loaded. Counted by load day, nothing was late. Counted by event hour, a block of night hours was empty. The nightly batch had never arrived. "Late" and "lost" are two different queries, and the agent could run both because the platform declares the two times separately.
Then the neighbours. Another stream from the same source had the same hole, while a stream on the same connection was normal. So the gap wasn't one table's problem.
Below staging sit the raw landing tables, keyed by extraction time, with the event time carried inside the payload. They showed a gap of about three hours twenty minutes overnight. Nothing had been back-filled later.
The last check was a witness. Right after the gap, events started appearing whose previous state contradicted the last state we had captured for that customer. The source system had moved on and processed the night as usual. We just hadn't been there to see it, so the data wasn't delayed. It was lost.
The whole walk took about seven minutes of queries, inside a fifteen-minute standup.
In plain words: the connection from the source's event stream stalls overnight and resumes in the morning. That night the consumer resumed about three hours twenty minutes past where it had stopped, so it skipped the nightly batch while the source system processed it normally. The cursor moved on without the data. How the ingestion connector came to resume at that point is still a hypothesis, and it's labelled as one in the incident note. Nobody read a log during the walk.
Before standup ended I could say it out loud: we already know the root cause. The written incident note followed about an hour later.
- 01consumption layer[ LOW ]subscription-event fact table
- means:
- which columns flag a churn, which column is the time axis
- from:
- the business-model view the table declares as its source
- 02business model[ STILL LOW ]subscription entity
- means:
- status attribute, ingested as a full log, the whole source on every run
- from:
- the entity's mapping to its source
- watermark none, so none to skip a day
- batch windows the day was read
- 03mapping and view[ NO DAY DROPPED ]entity mapping, the view that names its tables
- means:
- the joins between the staging tables
- from:
- the exact staging tables the view names
- 04staging[ LATE ≠ LOST ]transition events
- means:
- event time and load time, declared as separate columns
- from:
- the source's event stream
- by load day nothing late
- by event hour night hours empty
- 05neighbouring streams[ NOT ONE TABLE ]same source, same connection
- means:
- which streams share a source or a connection
- from:
- the other staging tables
- same source same hole
- same connection normal
- 06raw landing[ GAP ~3H20M ]landing tables
- means:
- keyed by extraction time, event time inside the payload
- from:
- the ingestion connection
- back-filled later nothing
- 07witness check[ ROOT CAUSE ]events right after the gap
- means:
- previous state against the last state we captured
- from:
- the source system, which moved on
- the data lost, not late
Two Questions at Every Hop
Look back at the walk and the same two questions come up at every hop. What does this mean? Where does it come from? The first is answered by a declaration: the churn flag on the fact table, the status attribute and its ingestion strategy, the two time columns in staging. The second is answered by a mapping: the view the fact table declares as its source, the entity's mapping, the staging tables its view names.
Those two questions have names. "Where does it come from" is technical lineage: the path the data took from source to dashboard. Most platforms have some of it, usually reconstructed after the fact by a tool reading the SQL. "What does it mean" is semantic lineage: the definition the data carries at every layer, connected along that same path, so a churn on the dashboard leads back to what a churn is in the business model. Few platforms have that, because few declare it. Semantic lineage tells the agent what to check; technical lineage tells it where. Here both were declared in full, and that's what the agent walked.
The hops run through three layers. At the bottom is what the source systems recorded, exactly as they recorded it. Above that is the business model, the company's agreed meaning of its own business: what a subscription is, what its statuses are, what counts as churn. On top is the consumption layer, what a dashboard reads. The Design of Analytical Data Storage Systems covers why they're kept apart. For the walk, what matters is that each layer says what it holds and where it got it, in a form an agent can query.
The hop that needed a declaration most was the one in the middle, from the business model down to source. On a hand-built warehouse, "did the transformation skip the day?" is archaeology. You open the job's code, reverse-engineer its watermark logic, and probably re-run it to see what it does with that date. Here three declarations answered it in one metadata query: the attribute's full-log strategy (no watermark to skip with), the recorded batch windows (the day was read), and the mapping with its view (the joins can't drop a day). That one query is where the question changed. "Did we lose it?" became "did it ever arrive?", and the second question points down toward staging and raw landing. Nobody had to go sideways into the transformation code.
Staging made the same point from the other side. A hole in the data looks the same whether it's late or lost, until you can count it by two clocks. Because the platform declares event time and load time as separate columns, "is anything late?" and "is anything missing?" are two queries with two answers. The agent never had to work out which timestamp some piece of code happened to filter on.
None of this needed a smarter model. What supercharged the agent was that both lineages exist as data, and that data isn't documentation written next to the platform. On this client's platform, Daana CLI generates every layer from those declarations, so the declarations are the implementation. Documentation that is the implementation can't drift from it: when the platform changes, it changes because a declaration did. Reading data is something agents are already good at. Guessing what a column means is the part they're bad at, and on this platform there was nothing to guess.
The Same Bug on a Warehouse Nobody Declared
Now run the same fault through a warehouse where none of this is declared. You've probably lived some version of it.
The same message arrives the same way. A ticket gets opened. The first real question is the same one, did the transformation skip the day, and the answer lives in transformation code written a couple of years ago. The person who remembers how it handles watermarks has moved to another team, or is on holiday (it's always holiday). So someone reads the code line by line, works out what the incremental logic probably does, and re-runs the job against a copy to make sure.
Then staging. The table has two timestamps and the code filters on one of them. Which one? Nobody wrote it down, so "late" and "lost" can't be told apart until someone reconstructs which clock the pipeline was counting by. By the time anyone opens the raw landing tables, the day is gone, and the dashboard on the wall is still wrong.
The route from a dashboard figure back to a raw event existed on that platform too. It lived in a few people's heads, so finding the fault meant finding the people first.
And yes, an engineer who knows that warehouse well would get there, maybe almost as fast. That's the uncomfortable part: on the undeclared platform the speed belongs to a person, and it leaves when they do.
Put an agent on that warehouse and it inherits the problem with less memory. It has to guess what each table means and follow SQL it didn't write. You can hand it more context, and Context Isn't Enough explains why that only goes so far when the context is compensating for a platform that never said what it means.
Fixed Once, Healed Everywhere
The fix itself was undramatic. Once the missing window was ingested again, the normal nightly runs absorbed it, and every layer above it, the business model and the dashboards included, was right again. Nobody wrote a backfill script or patched a table by hand. That's the other half of the same declarations: the agent could walk down them because they describe every layer, and the platform could heal because every layer is generated from them. Fix the input once, and the next normal run is the repair.
What Walking Cannot Fix
The churn number read low at every hop, from the dashboard to the raw landing tables. The walk didn't work by catching the platform disagreeing with itself. It worked because missing data has a place where it starts: a hop below which the gap is real, and above which every layer is faithfully reporting what it was given. The declarations let the agent walk down until it found that place.
A wrong definition has no such place. Say the business model counts a subscription as churned on the wrong event. Every layer generated from that definition is wrong in the same way, all the way down, and each hop agrees with the one below it. There's no hop where the fault starts, so there's nothing for a walk to find. Making "Talk to Your Data" Actually Work puts it as consistency looking a lot like correctness from the outside.
So a declared platform makes an agent fast at finding where data went missing or arrived late. Semantic lineage tells you what a number means at every hop. It can't tell you the meaning is right. Whether what you declared was right in the first place is still a question for the people who own the meaning, and a senior leader asking it out loud is part of how that works.
A Colleague That Investigates
What happened at that standup wasn't an agent answering a question. Nobody asked it what churn was. It was handed a number that looked wrong and went to find out why, one hop at a time, reading what each layer means and following where it comes from, while the people who would normally do that walk got on with their standup.
That's a different kind of colleague. One you ask things is useful. One that can go and investigate, and come back with a root cause before the meeting ends, changes what a data team spends its mornings on. The model didn't make that possible. The platform did, by declaring itself all the way down.
If you're at Data & AI Stockholm on 14 October, come and find us. I'm happy to walk through it again, slower this time.