
- Published on
From Business Question to Working Prototype in Hours
- Authors

- Name
- Siavoush Mohammadi
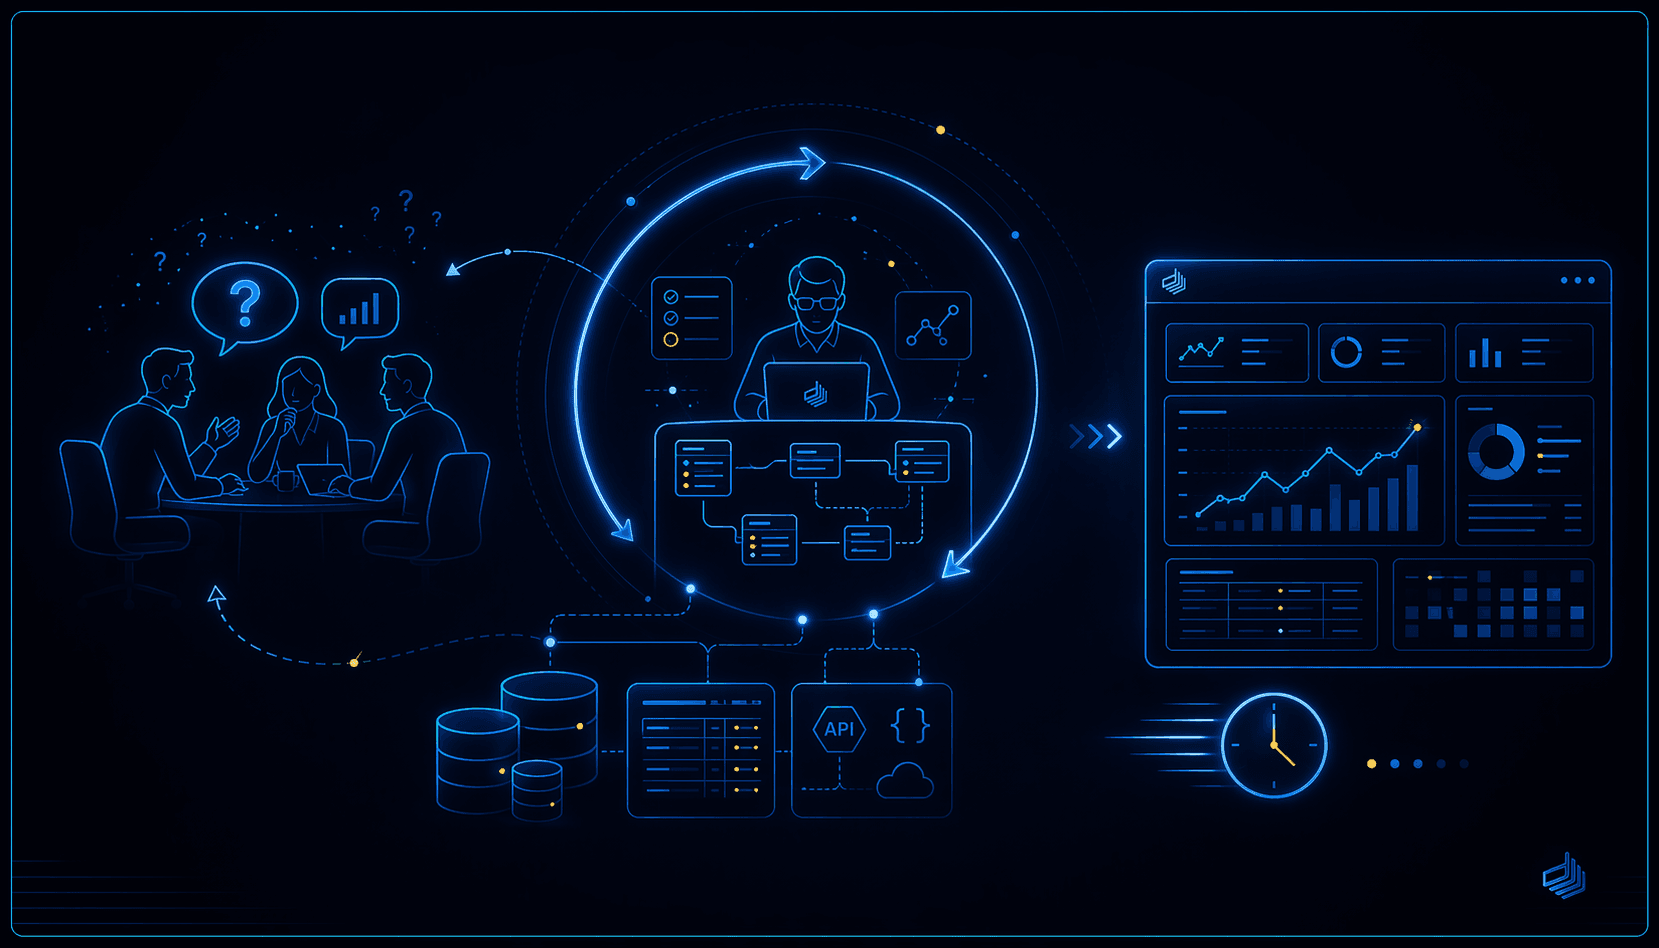
You know the pattern. Someone senior says "we need better analytics." Six months later, a team has built dashboards nobody asked for, reports that answer the wrong questions, and a data model that doesn't map to how the business actually thinks. Everyone's frustrated. The data team feels underappreciated. The business feels unheard. And the whole thing starts over.
The problem isn't the tools or the team - it's that nobody sat down with the business and figured out what they actually need before building anything.
There's a methodology that fixes this. I've used it at AFA Försäkringar, CEVT (Geely), Tele2, and plenty of others across insurance, automotive, telecom, streaming, and market research. I also taught it as part of SAS Institute's Analytics Value Training Program. I call it "Agile Analytics" - and no, it has nothing to do with Scrum or sprints, but rather the principles behind agile.
The core idea: go from "we need analytics" to a working prototype in a single iteration - hours, not months. The trick is compressing five activities into a tight feedback loop. And yes, your mental calculation is correct, this worked even "pre-AI".
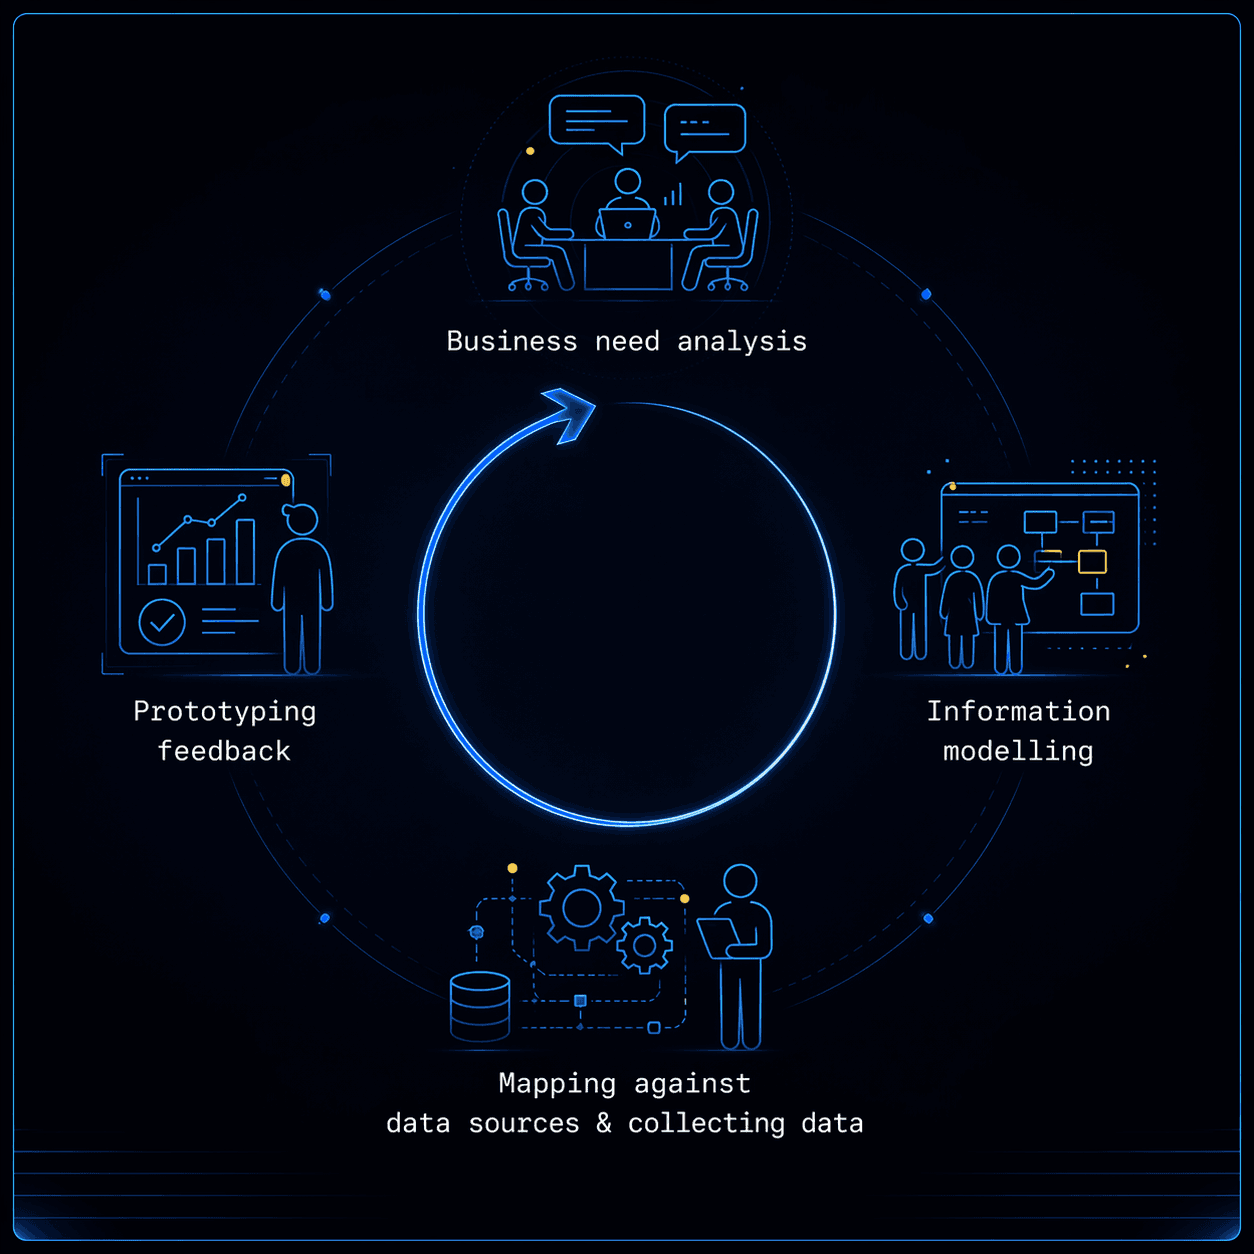
The Five Steps
Five steps, three groups of people, one goal: get to a working prototype as fast as possible while actually modeling the business correctly.
The three groups you need in the room:
- The business - the people with the questions. They know what they need (even if they can't articulate it yet)
- IT/data - the people who know where the data lives and what it means in the source systems
- The facilitator - the person who bridges both worlds. On a small team, this is usually the most senior data person. On larger teams, a data architect or external consultant. The key skill isn't technical depth - it's the ability to listen to the business and translate what they say into structure.
Time commitment: Steps 1 and 5 are workshops with the business (60-90 minutes each). Steps 2-4 are internal work that a good facilitator can compress into a day. An entire iteration can be done in a week. With practice and the right prep, I've done Steps 1 through 5 in a single day.
The pitch to get stakeholders in the room: "Give us 90 minutes. We'll show you a working prototype within a week. If it's wrong, we've lost a week. If we do it the traditional way, you'll wait months and it'll probably still be wrong." I've never had an executive say no to that.
To make this concrete, I'll walk through an example alongside the methodology. Let's say you're working with an e-commerce marketplace - sellers listing products, customers placing orders, shipments going out. The CEO wants to "understand performance" and "see what's trending." Vague, right? That's where Step 1 comes in.
Step 1: Business Needs Analysis (Workshop, 60-90 min)
A workshop with the business - an open, in-depth interview where you capture core business concepts, their attributes, and how they relate to each other. Think of it as extracting an information model (bear with me, don't get stuck on the word) from the heads of the people who actually run the business.
The technique: start open-ended, then gradually close down as the picture sharpens.
Open: "Tell us about your business and what's painful right now." (gives you context, motivation, scope) Closed: "Do you need this specific metric?" (gives you a yes/no - useful once you know the landscape)
Here's what to listen for - the part most facilitators miss:
- Nouns that keep repeating? Those are your entities. "Customer," "Order," "Product" - the core business concepts.
- Verbs between the nouns? Those are relationships. "Customer places Order," "Order contains Product."
- Adjectives describing the nouns? Those are attributes (or sometimes values attributes can take). "Active customer," "total order value," "product category."
You're building an information model (there it is again, push through) in real time, just by listening carefully.
TIP
So what IS an information model? Think of it as a map of how your business thinks. Not a database diagram - those are for computers. An information model captures what "Customer" means, what "Order" means, and how they relate - in language both the business and the data team can agree on. It's the shared vocabulary that prevents the "but I meant THAT kind of customer" conversation three months into a project.
The Example: Listening to the CEO
The CEO says: "We have sellers on our website selling their products to customers placing orders, then we ship the products to the customers. I need to understand our performance - measuring orders, order value, what product categories are trending."
Four nouns jumped out immediately: Seller, Product, Order, Customer. Those are your starting entities. But notice - he didn't mention "order line." By asking "can a customer order multiple products in one order?" you discover a fifth entity: Order Line. He knew this implicitly but didn't say it because it's obvious to him. Don't let things be unsaid even if you think it's obvious. Don't assume during these discussions, more often than not there are nuances that we need to understand.
CAUTION
ASS-U-ME: When you assume, you make an ASS out of U and ME. In workshops, this means: if something seems obvious, ask anyway. The answer is rarely as obvious as you think.
Now look at the verbs: seller sells product, order line belongs to order, customer places order. Those are your relationships.
After 30 minutes you have a rough model:
Five entities and four relationships, extracted from a single paragraph of the CEO talking about his business.
The W Framework
Seriously, this is what you want answered by the end of the workshop: who does what, how, when, where, and why? But you can't just throw that at someone. You tease it out:
- Why are we doing this? Why does this business process matter?
- What do you actually want to measure? What kind of event or phenomenon?
- Who performs the action? Who's interested in tracking it?
- How does it occur? How often? How much?
- Where does it take place?
- When does it happen? At what frequency?
And the question that separates useful analytics from dead dashboards: "What will the business actually DO with this information?" If nobody can answer that, you're about to build a report nobody will look at after week two. I've seen this happen more times than I can count - beautiful dashboards gathering digital dust because nobody thought to ask why they needed them.
What You Walk Out With
Two things:
A rough information model (third time, see it's not so bad) at post-it level (or Miro/Lucidspark if you're remote). Core business concepts, their relationships, and definitions. Don't worry about getting every attribute right - the structure matters more than the details at this stage.
A prioritized list of business questions. Actual questions. You'd be surprised how often you get "number of customers!" back. That's not a question - there's no question mark. Push them: "How many customers do we have?" Better. "So I'll build a dashboard with one big number in it, happy?" No? Then try again. A good business question looks like: "How many new customers do we get over time and by product category?" Now you can validate your model against it AND prototype a visualization. (I wrote a whole article about the anatomy of a business question if you want to go deeper.)
The Example: Business Questions
From our marketplace CEO, after some back and forth, we land on:
- What's the average order value over time and product category?
- What are the most popular product categories?
- What's the revenue per geographical area?
- Which sellers are our top revenue generators?
- What's the revenue per day and payment type?
Specific enough to build visualizations, clear enough to validate against the model.
Step 1 Checklist
- Come prepared - know their business before you walk in
- Open with scope: "What in this presentation of the scope do you think is NOT correct?" (forces critical thinking over polite nodding)
- Let the business speak freely - IT should NOT control the conversation
- Listen for repeating nouns (entities), verbs (relationships), adjectives (attributes)
- Push vague answers into proper business questions (with question marks!)
- Capture the rough information model visually (whiteboard, Miro, post-its)
- Understand the business process you are modeling
- Prioritize the business questions before leaving the room
- Remember: assumption is the mother of all fuck-ups
Step 2: Information Modeling (Internal, half-day)
Puh... finally here.
The internal work between workshops. You take the post-it level sketch from Step 1 and turn it into a proper information model.
An information model is the communication layer between business and data. Structured enough to drive implementation, clear enough that a non-technical person can understand how their business's information connects. If they can't understand it, you've over-engineered it.
You already identified the building blocks during the workshop - now formalize them into a digital model. These entities - sometimes called Core Business Concepts - are the building blocks of your information model.
The model is what makes business questions answerable. Each question maps to entities, relationships, and attributes. If your model can't answer the prioritized questions, something's missing.
The Example: Model with Attributes
Back to our marketplace. We digitize the model and add attributes through a short follow-up:
Now validate the model against the business questions. Can we answer question 1 ("average order value over time and product category")? We need order_value (have it), order_date for "over time" (have it), and product category... wait. We don't have a product_category attribute. Back to the business or flag it for the next conversation. Better to catch this now than after building a pipeline.
And question 5 - "revenue per day and payment type." We don't have a Payment entity at all. The CEO mentioned orders and shipping, not payments. That's a gap the model just revealed. This is the methodology working exactly as designed.
Step 2 Checklist
- Digitize the workshop sketch into a "proper" information model
- Write clean definitions for every entity and attribute
- Validate: can every prioritized business question be answered by this model?
- Don't accept vague definitions - "Customer" means different things to sales vs marketing. Pin it down now.
- Call the business if you're unsure about something - they probably weren't clear enough
- Keep it simple - an iterative, experimental approach beats perfection
- Note where definitions are still unclear - show different interpretations during prototyping
Step 3: Mapping to Data Sources (Workshop with IT, 60-90 min)
Another workshop, but without the business this time. This is you and the IT/data people figuring out: where does the data actually live? Having business people in this session slows things down and frustrates them - it's a technical conversation.
Take the information model and the prioritized business questions, and map: which source systems, tables, and columns feed the answers?
NB: Many times the data folks actually know this pretty well already. Chances are a first prototype can be made without the source system devs, but I always think we get better and sharper results with them in the room.
The Example: Source Mapping
Back to our marketplace. The IT team tells you:
- Seller and Product data → Postgres
marketplace_db, tablessellersandproducts - Order and Order Line → Postgres
marketplace_db, tablesordersandorder_items - Customer → Salesforce CRM,
Contactobject - Payment (the missing entity from Step 2) → Stripe API,
chargesandpayment_intents
Two source systems for core data, a third for the missing entity. Now you know: questions 1-4 can be answered from Postgres alone. Question 5 needs Stripe. Go back to the business: "We can prototype questions 1-4 this week. Question 5 needs the Stripe connection, which takes a few days. Want to start with what we have?"
That's infinitely better than "we'll get back to you in six weeks."
Being proactive about what's possible NOW versus what needs development work separates good analytics facilitators from the ones who promise everything and deliver late.
Step 3 Checklist
- Bring the digital information model and prioritized business questions
- Only IT/data people in the room - business shouldn't attend this one
- Ask IT to share relevant source system data models in advance
- Map: which source systems, tables, and columns answer which business questions?
- Document integration gaps - what data isn't being captured or connected?
- Prepare honest feedback for the business on what can and can't be answered right now
- Suggest alternative questions when data isn't available ("we can't answer X yet, but we CAN answer Y")
Step 4: Prototyping (Internal, hours)
Information model, prioritized questions, data sources mapped. Now build the prototype.
It doesn't need to be pretty. It needs to be fast and correct enough to get feedback. Use whatever BI tool your team knows - Power BI, Tableau, Looker, a Jupyter notebook.
A quick guide for choosing the right visualization:
- Trends over time? Line chart or area chart
- Comparing categories? Bar chart (horizontal for many categories)
- Part of a whole? Stacked bar or pie chart (pie only for 2-5 segments, please)
- Distribution? Histogram or box plot
- Correlation? Scatter plot
- Single KPI? Card or gauge
Start with basic chart types. The fancy stuff (heatmaps, sankeys, word clouds) can come later (and more often than not, better not to have them at all, a dashboard that needs explaining to understand will die really fast). You want the business to react to the DATA and the DEFINITIONS, not get distracted by clever visualizations. Get feedback on whether you're working with the right data, KPIs, and definitions - those take the most time to fix if you get them wrong.
You WILL find gaps during prototyping. That's the point. Better here than in a production dashboard built over months.
The Example: Prototype
For the marketplace, you'd build three visualizations from Postgres alone: a line chart of average order value over time (question 1), a bar chart ranking product categories by order count (question 2), and a map breaking down revenue by seller postal code (questions 3 and 4). Four of five business questions answered from a single source system in an afternoon. Question 5 waits for Stripe - and you tell the CEO that upfront.
Step 4 Checklist
- Time-box it - a prototype, not a production dashboard
- Focus on answering the prioritized business questions, nothing else
- Use the model's definitions - if "Customer" means X in the model, that's what it means in the prototype
- If source data isn't ready, use mock data to validate the structure
- Note every gap and assumption you had to make
- Don't polish - the business needs to react to the substance, not the aesthetics
Step 5: Feedback (Workshop with business, 60-90 min)
Sit down with the business. Show them the prototype. Three things will happen:
- Validation: "Yes, this answers our question." Ship it as an MVP.
- Refinement: "This is close, but we also need X." Add it to the backlog, prioritize on the spot.
- Pivot: "Actually, now that I see the data, what I REALLY need is..." Capture it. This is gold. The business is learning what they actually need by seeing their own data.
All three are wins. Expect 2-3 iterations before something is production-ready, but each iteration is fast - you're refining, not rebuilding.
The Example: CEO Feedback
The CEO validates questions 1 and 4 immediately - average order value over time and top sellers are exactly what he wanted. On question 2, he pivots: "Actually, I don't just want a ranking - I want to see how categories trend over time. Are some growing while others decline?" Same data, different visualization, better insight. You note it. Question 3 prompts a new idea: "Can we see which geographical areas have the highest return rates?" New entity alert - you don't have a Returns concept in the model yet. Captured for iteration two. Validation, refinement, and a pivot that reveals a missing entity - the methodology working as designed.
Step 5 Checklist
- Show the prototype against the original business questions
- Ask: "Does this answer what you asked for? What's missing?"
- Look for quick wins - simpler business rules, easy filters
- Capture new ideas that emerge from seeing the actual data
- Decide: is this good enough for production as an MVP?
- Prioritize next iteration improvements on the spot
- Don't be surprised if priorities shift - that's the methodology working
From Prototype to Production
After 2-3 iterations, the prototype is validated - the business has confirmed it answers the right questions with the right definitions. Now what?
The prototype is NOT the production dashboard. It's the validated blueprint. The information model, business questions, and agreed definitions are the real deliverables - they tell your data team exactly what to build, with zero ambiguity about what "Customer" means or which metrics matter.
Production hardening - proper pipelines, scheduled refreshes, access controls, monitoring - is a standard engineering task. But your team now knows WHAT to build, because the methodology forced alignment before anyone wrote a line of pipeline code. That's where the months of rework disappear.
Who owns it after handoff depends on your setup. On small teams, the facilitator often IS the person building production. On larger teams, the facilitator hands the model and definitions to engineering. Either way, the information model stays as the shared reference - new team members read it to understand the domain, not the SQL.
When NOT to Use This
This methodology earns its keep when you have multiple business domains, source systems, or teams that need to agree on what things mean. That's where the information model pays for itself many times over.
If you have three tables and one stakeholder, skip the methodology and just build the dashboard. The overhead of workshops and information models isn't justified when you can see the entire problem on one screen. If you're building a one-off ad-hoc analysis that nobody will look at twice, same thing - just do it. HOWEVER, if you keep building out the data platform's information model, those ad-hoc analyses will become REALLY quick to do, and many times the stakeholders can do it themselves. They have a glossary, maybe you've even built a semantic metric layer, the oh so fleeting "self-service BI" can actually work.
The methodology is for the other 90% - the stuff that's supposed to last, that other people need to understand, and that the business will want to extend next quarter. That's where "we aligned on definitions first" saves you from "we built the wrong thing."
A whiteboard, a BI tool (Google Sheets / Excel can even work), and a week with the right people. With practice, a day. Try it on your next analytics request and see what happens.
If you're reading this thinking "but we don't need this, we have AI" - yes, and that makes this process much faster. But try pointing your super AI to a lake with hundreds of tables, 10 of which have something with "customer" in the name with columns called cust_id, SSN, customer_number etc. and watch it desperately try to please you by hallucinating solutions. The opposite is also true - give an AI a model with clear descriptive definitions and watch it do magic.
Tips & Tricks from the Field
Everything above is the methodology. What follows is a decade of scar tissue - things I've learned the hard way running these workshops across insurance, automotive, telecom, streaming, retail, restaurants, market research and other. Think of it as the appendix you'll want when you're actually sitting in the room.
On Facilitating
Use the "X" trick when teams can't agree on a name. If people are debating whether to call something "Order" or "Transaction" or "Purchase," stop them. Call it "X." Define what X IS first - when it's created, what properties it has, how it relates to other concepts. Once everyone agrees on the definition, the name usually becomes obvious. I've seen 30-minute naming debates dissolve in 2 minutes with this trick. Incredible how passionate we can become over names.
Let uncomfortable silences sit. After you ask an open question, the business needs time to think. Don't fill the silence. The best insights come after the pause, not before it.
Bring a printed version of the information model to every follow-up session (or draw the entity level on the white board). Something about seeing it on paper/whiteboard makes people engage differently than on a screen. They'll grab a pen and start annotating. That's what you want.
The best sign that the methodology is working: when the business team starts correcting each other's terminology. "That's not what we mean by 'active customer' - we defined it as..." At that point, you've won. I've seen teams become stricter about definitions than the facilitators who introduced them.
On Information Modeling
Start with events, not states. "Customer places Order" is easier to model than "Customer Status." Events have clear timestamps, clear participants, and clear relationships. States are derived from events. Start with what happens, then figure out what that means about the current state.
If two people in the same company define a term differently, that's not a problem to solve - it's a finding to document. Maybe sales and marketing SHOULD have different definitions of "active customer." The model captures both and makes the difference explicit. Just don't name it the same thing. So-called "homonyms" are toxic. Document both definitions now. Eventually you'll need to standardize, but during the workshop, capturing the disagreement is more valuable than resolving it. Most likely it actually IS two different things and they are just using the same word for it.
Don't model everything. Model what answers the top 3 business questions. You can always expand later. The goal of iteration one is proving the approach works, not capturing the entire business domain. I've seen too many modeling efforts stall because someone insisted on modeling every edge case before delivering any value.
On Getting Buy-In
Frame it as risk reduction, not methodology adoption. Executives don't care about "agile analytics" or "information modeling." They care about "we'll know within a week if we're building the right thing." That's the pitch. Usually the first workshop is enough to create massive engagement.
Show, don't tell. Run the methodology once on a small, low-stakes analytics request. When the business sees a working prototype in days instead of months, they'll ask you to do it again. Mandating the methodology top-down never works as well as demonstrating it bottom-up.
The biggest ROI isn't the dashboards. One organization I worked with estimated they became roughly 15% more efficient just from aligning on shared definitions across teams. Not from new analytics - from people finally meaning the same thing when they used the same words.
On Common Mistakes
Don't do "dry modeling" for too long. It's tempting to keep refining the information model in workshops without building anything. Resist. Get to a prototype as fast as possible. A rough prototype teaches you more about what's wrong with your model than three more workshops will.
Don't let IT drive the workshop. IT people naturally want to talk about what data exists. That anchors the conversation in what's possible instead of what's needed. Let the business speak first. What data exists is a Step 3 problem, not a Step 1 problem. Also, many times, the free modeling can create the realization that the source system needs to start logging something in a business process that it wasn't before.
Don't skip the business question validation in Step 2. This is where the magic happens - checking your model against the actual questions reveals gaps you'd never catch by staring at the model alone. Every time I've seen teams skip this step, they've discovered the gaps in production instead. Much more expensive.